
Previo Carrier
Florida property insurance by county. What is happening to property insurance in our county, and where is it heading?Previo Carrier in four minutes: one county from the dashboard to the page for the meeting. Real St. Lucie County figures; invented branding on the one-pager.
What it does
- Pick a county and the Dashboard answers from four public publishers: Citizens policies and their change in a year, the average homeowners premium with wind and the county's rank among the 67, hurricane-risk cancellations and non-renewals, homes with federal flood cover, and the twelve-month outlook. Each tile names its publisher and date.
- Citizens month by month from Citizens' own county reports since 2017, every product line, the policy and average premium charts with the forecast band, and the county's share of Citizens statewide.
- Premiums: the regulator's Property Insurance Stability Report, January and July since 2022, with the average premium by county computed from every carrier including the trade-secret filers; all 67 counties ranked with the change since the previous report.
- Market: the regulator's company-by-county data from 1996 to 2026 for any month and policy type, with cancellations, non-renewals for hurricane risk, new business and claims. The page calls them reporting carriers and shows the year-by-year exit of the trade-secret filers from the public files instead of hiding it.
- Flood: FEMA's residential take-up by county, the protection gap inside the flood zone, and every National Flood Insurance Program claim since 1978 by year, storm and ZIP code, addresses removed.
- Outlook: the Citizens series twelve months ahead with the 80% band of its own back-test, the back-tests by horizon, and approved rate changes rolling into renewals carrier by carrier. The county one-pager (PDF), the Excel workbook and the full-screen meeting deck (F5) are computed from the same summary.
Who it is for
- County and city finance and planning staff who must answer a commission when a carrier leaves; lenders, realtors and association boards who need the county picture; the consultants who advise them. Not insurers and not agents: it does not quote, rate or recommend coverage.
- Windows desktop; the 14-day trial needs no card. One button fetches everything from Citizens, the Florida Office of Insurance Regulation and FEMA into a local cache; no account, no key.
Screenshots
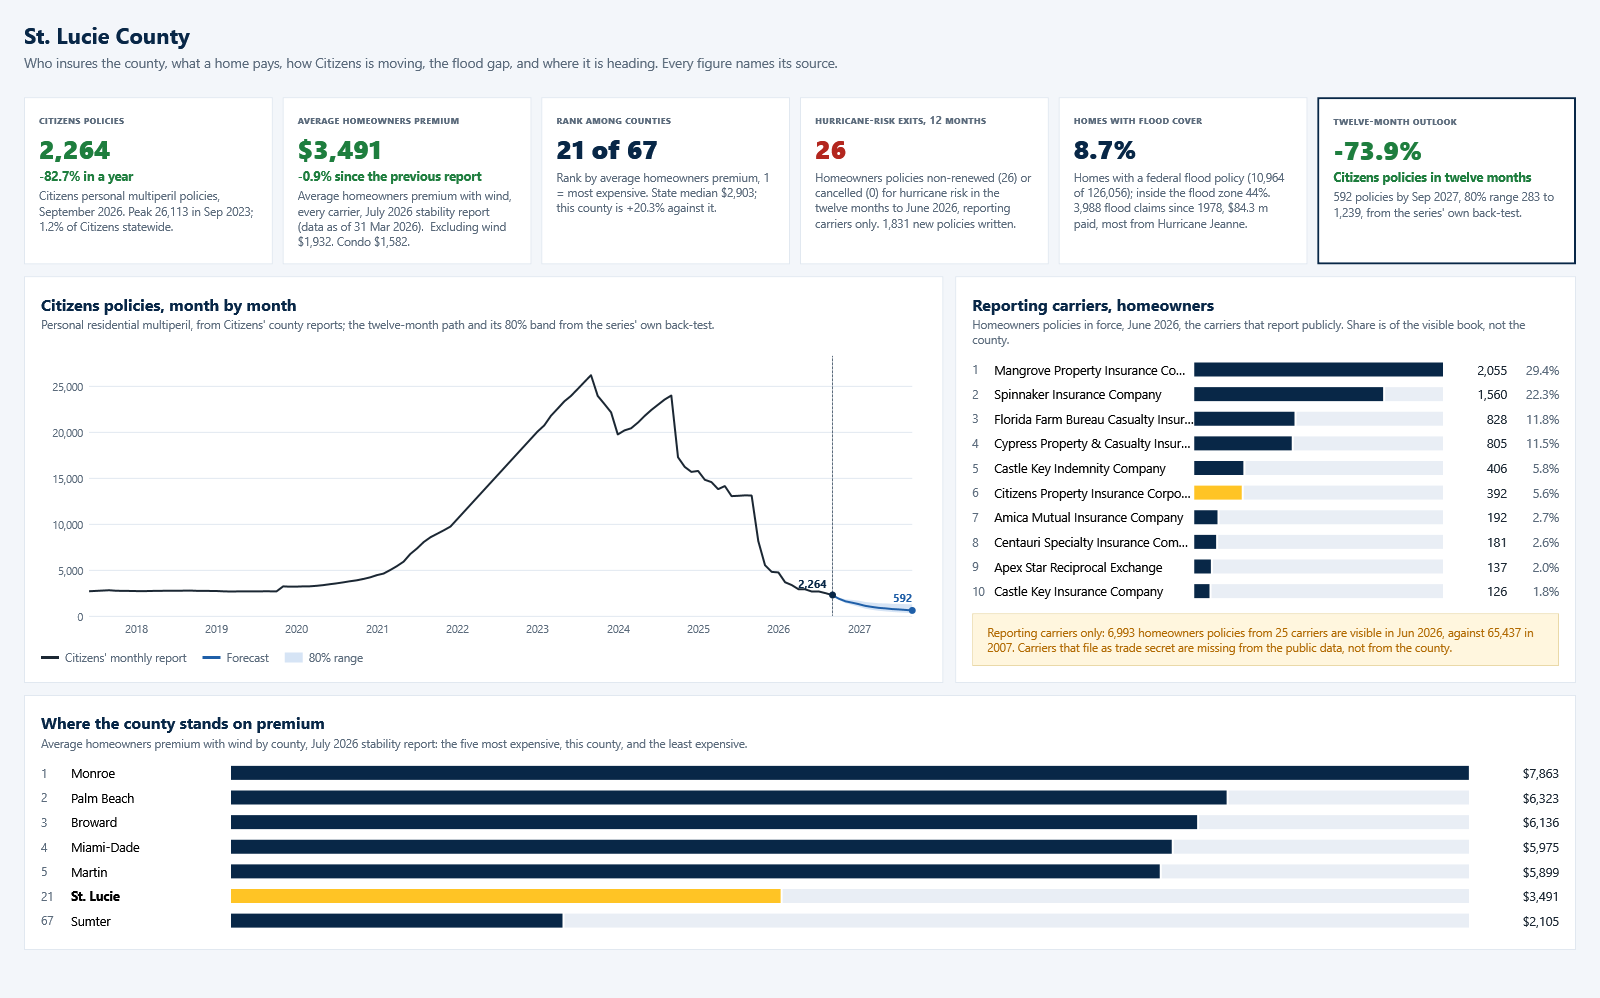
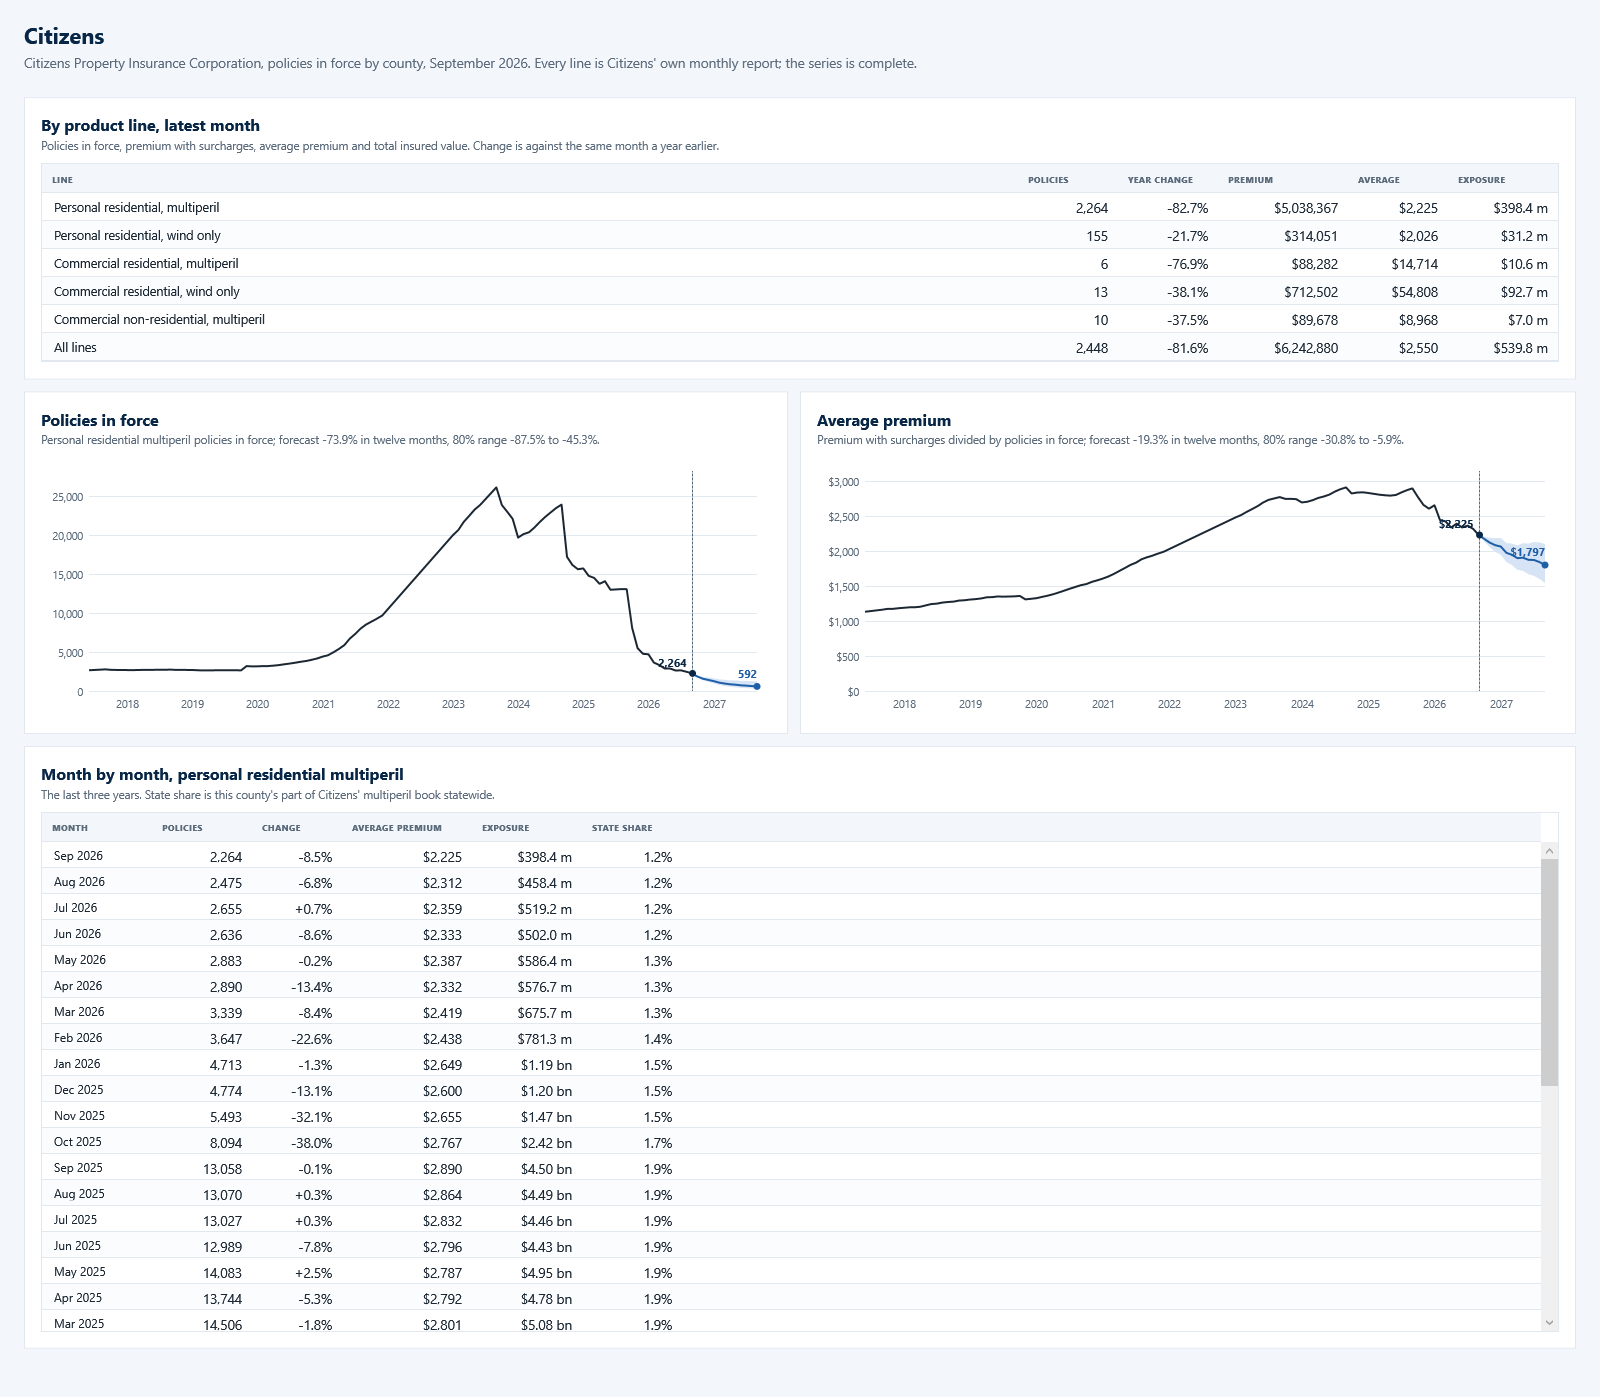
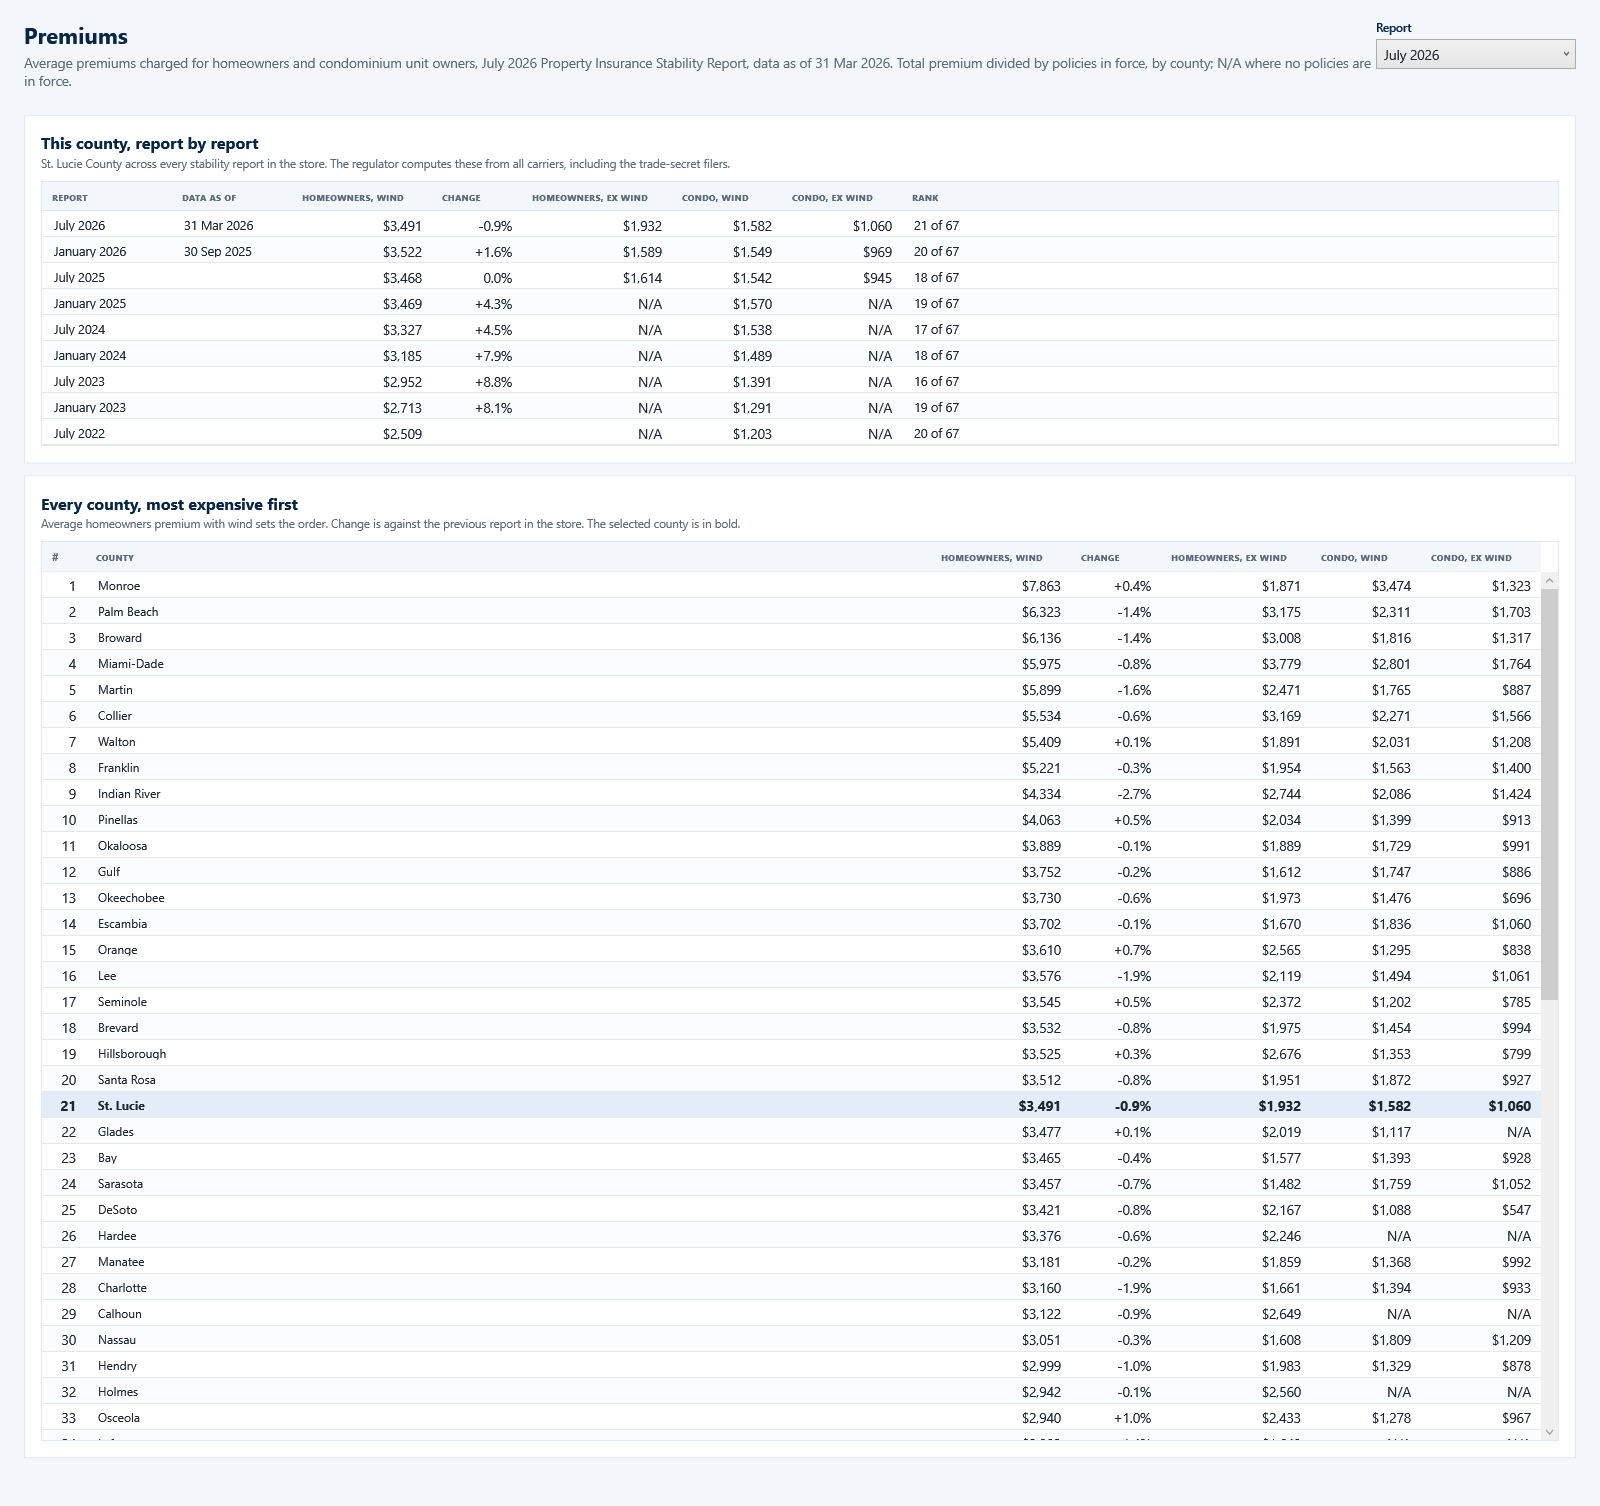
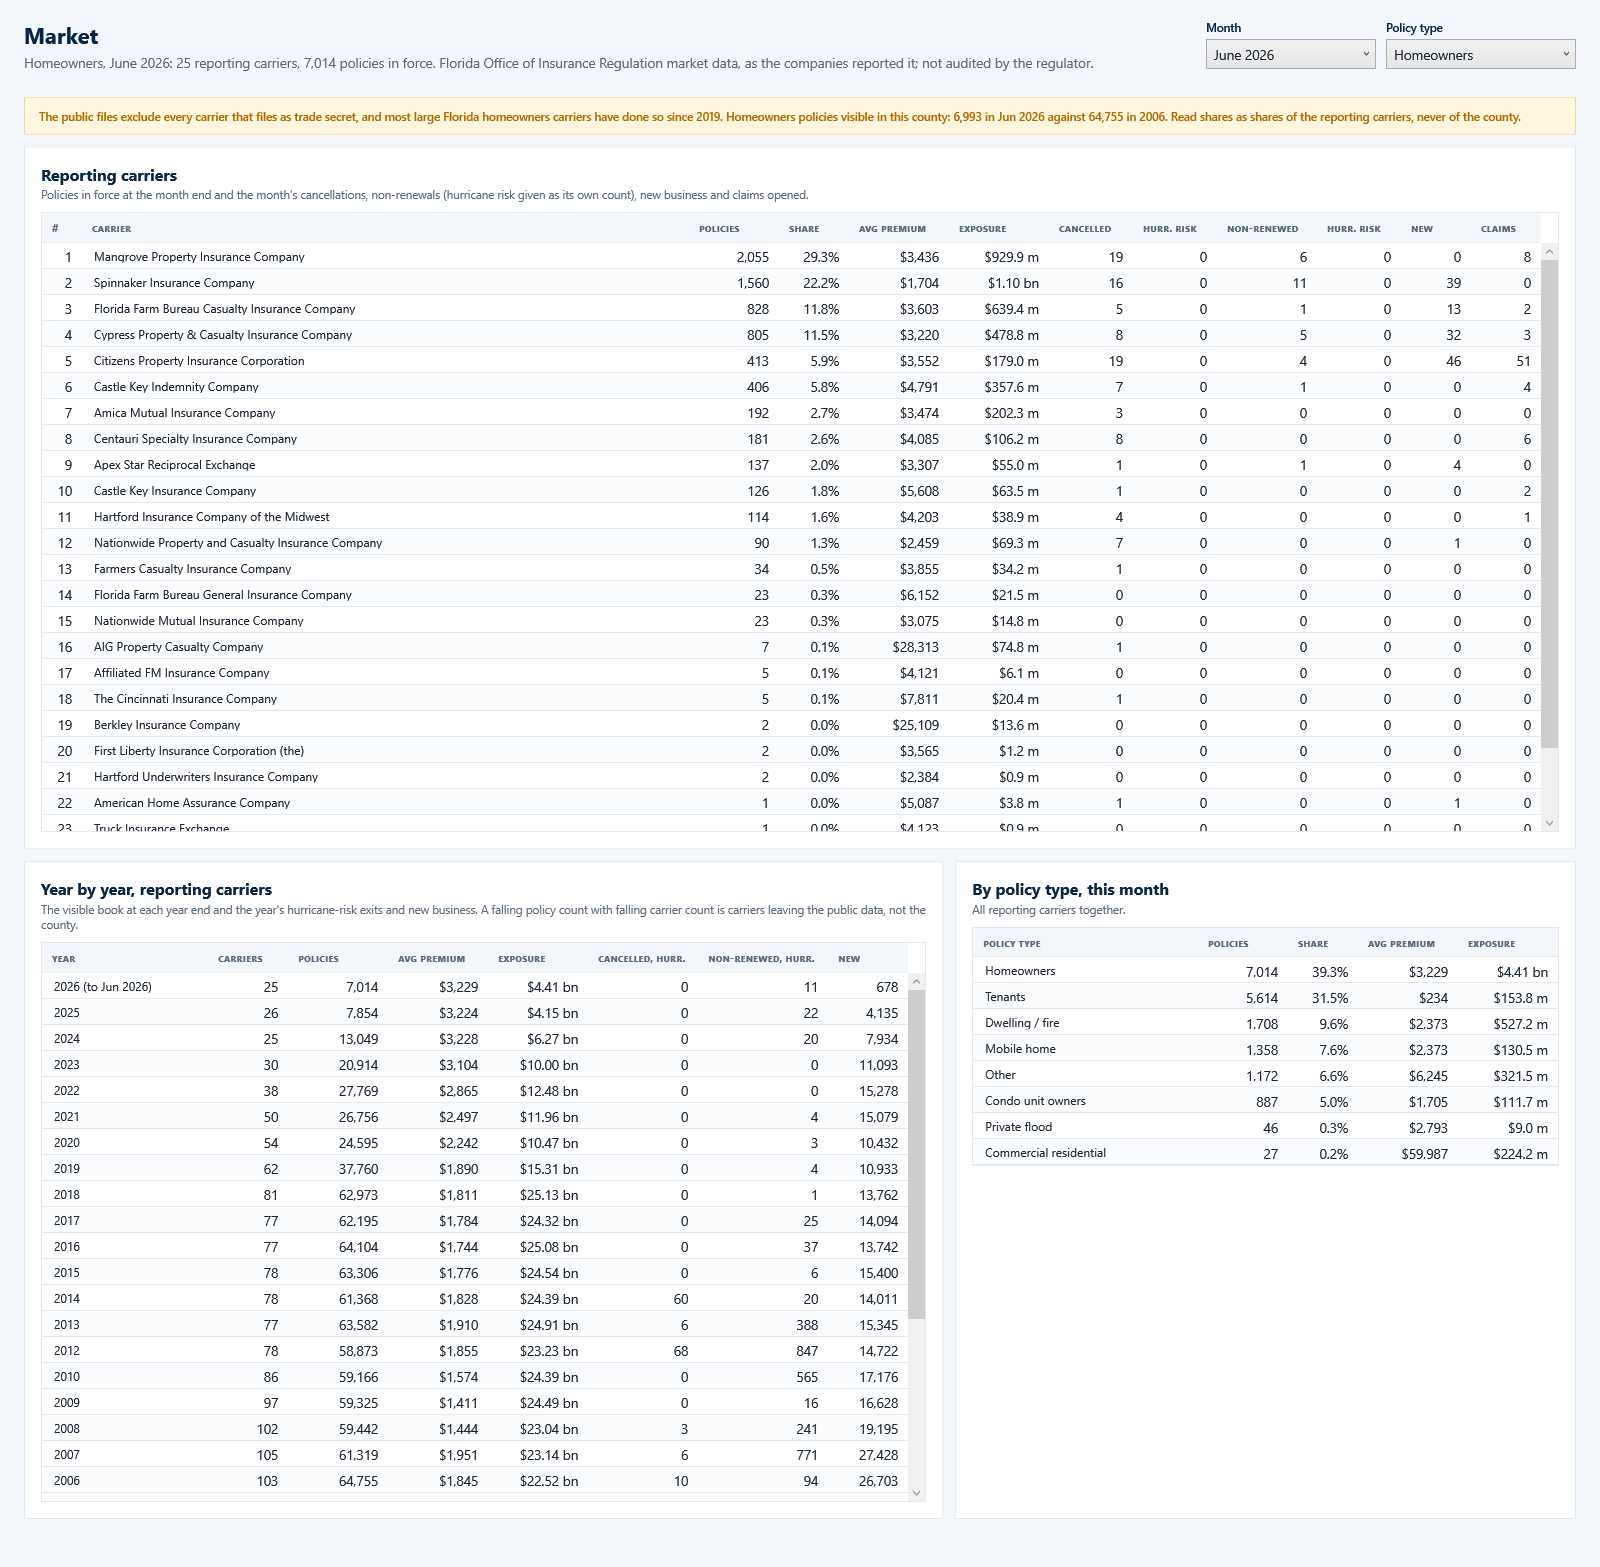
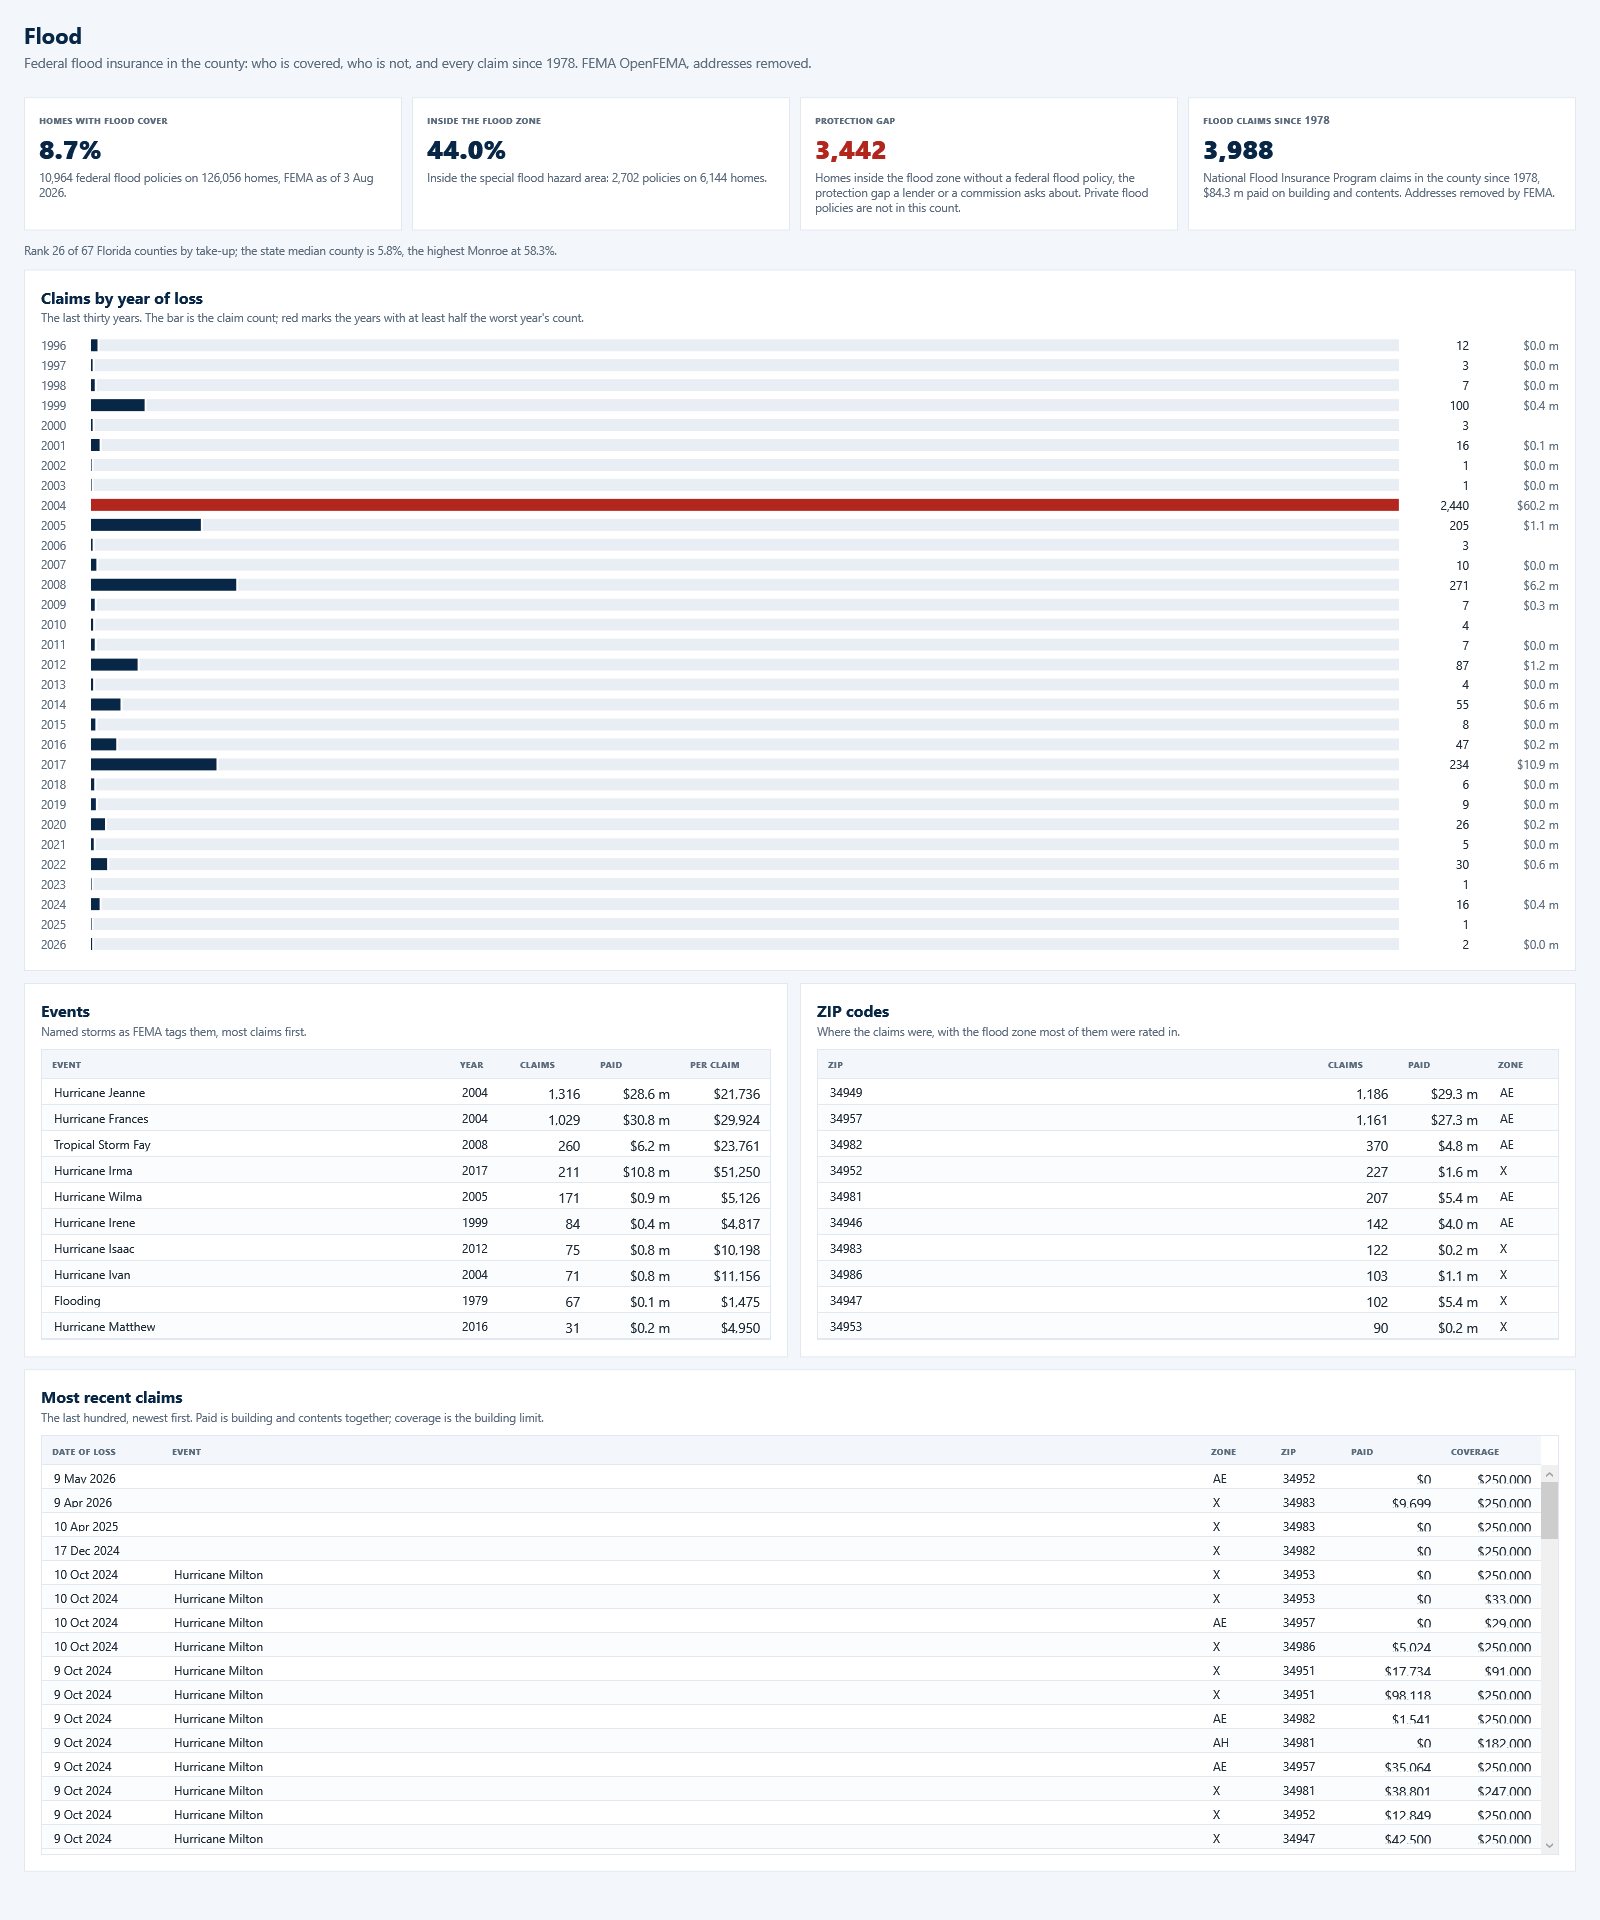
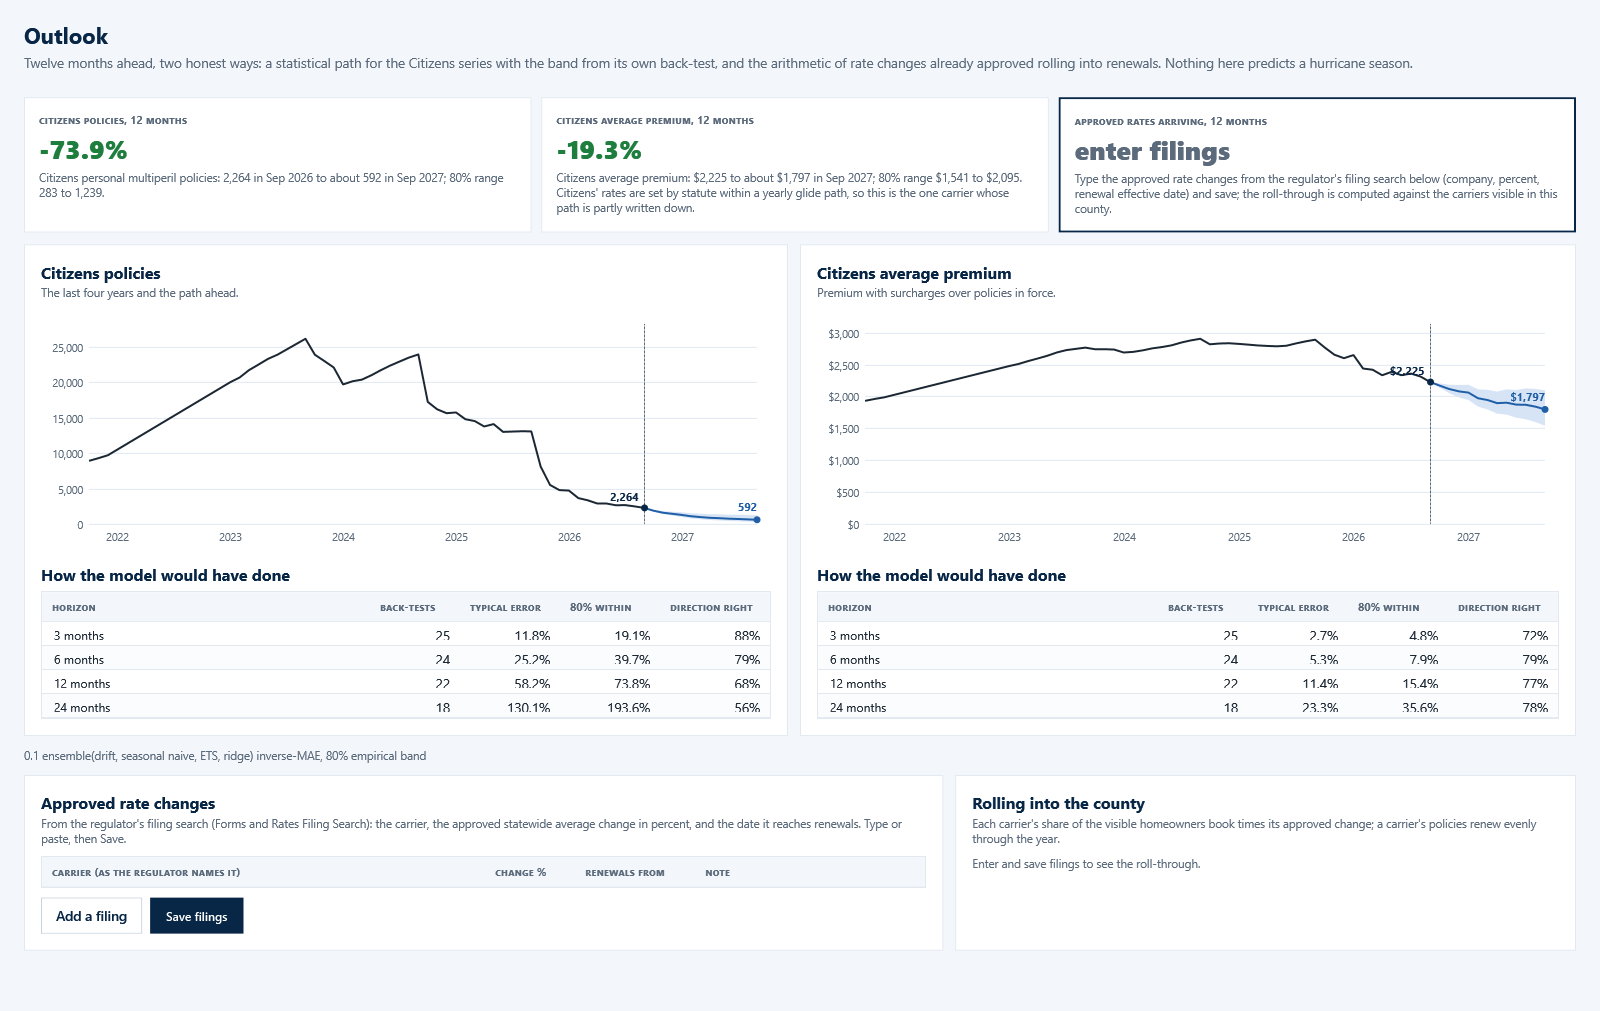
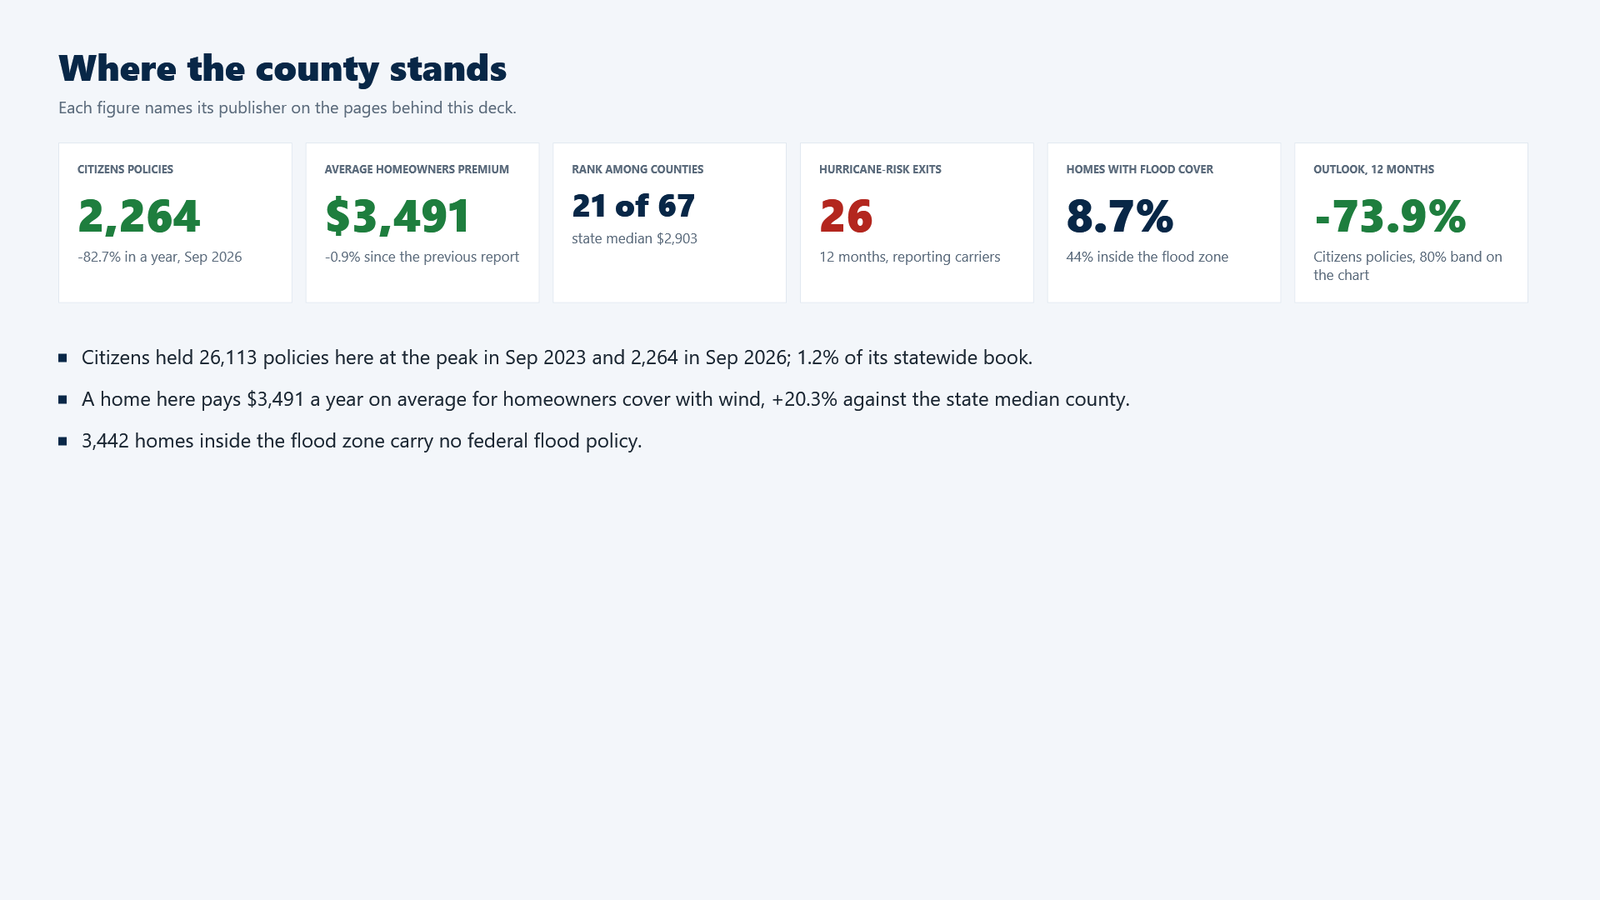
Every screen shows St. Lucie County's real public figures as of November 2026; the one-pager and the deck carry an invented preparer. The full description is on its page at deselt.com.
Help
The first day
- Pick the county in the strip above every page; the choice is remembered.
- Import everything on the Welcome page or Data Sources. Citizens, the stability reports and FEMA take about two minutes; the regulator's six market workbooks follow and take about a quarter of an hour the first time. Files stay in a local cache.
- Read the Dashboard, then Citizens, Premiums, Market, Flood and Outlook for the detail behind each tile. Ctrl+E for Excel, Ctrl+P for the county one-pager, F5 for the deck.
What is complete and what is partial
Complete: Citizens' monthly county reports (every policy Citizens holds), the regulator's average premium by county in the stability report (computed from every carrier), and FEMA's flood take-up and claims. Partial: the regulator's company-by-county market data excludes every carrier that files as trade secret, and since 2019 most large Florida homeowners carriers do. The app calls them reporting carriers, shows their shares as shares of the reporting carriers only, and prints the year-by-year exit from the public files rather than hiding it.
How the outlook is made
The Citizens series is forecast twelve months ahead by four deterministic models (drift, seasonal naive, damped Holt-Winters, a ridge regression on the series' own momentum), weighted by a rolling back-test; the band is the 80th percentile of the ensemble's own past errors, drawn only when four years of months exist. The rate roll-through is arithmetic: each carrier's approved change, weighted by its share of the visible book, reaching the county as policies renew evenly through the year. Nothing forecasts a hurricane season.
Where the numbers come from
Citizens Property Insurance Corporation, policies in force by county, monthly since 2017. Florida Office of Insurance Regulation: the Property Insurance Stability Report (January and July since 2022) and the market data compilations 1996 to 2026. FEMA OpenFEMA: residential flood take-up by county and the NFIP claims, addresses removed. All public, all free; the app needs no account and no key.
The one-pager and the deck
The county one-pager carries the six figures, the Citizens chart, the reporting carriers, where the county stands on premium, the flood line and every source in the footer; your company goes on the header from Settings. F5 opens the eight-slide deck full screen. Both are computed from the same summary as the dashboard, so they cannot disagree with it.
What it is not
Not a quote, a rate or insurance advice; it does not price a home or recommend a carrier. It reads the public record as published and says where each figure came from. The one-pager is a licensed feature; everything else works in the 14-day trial.